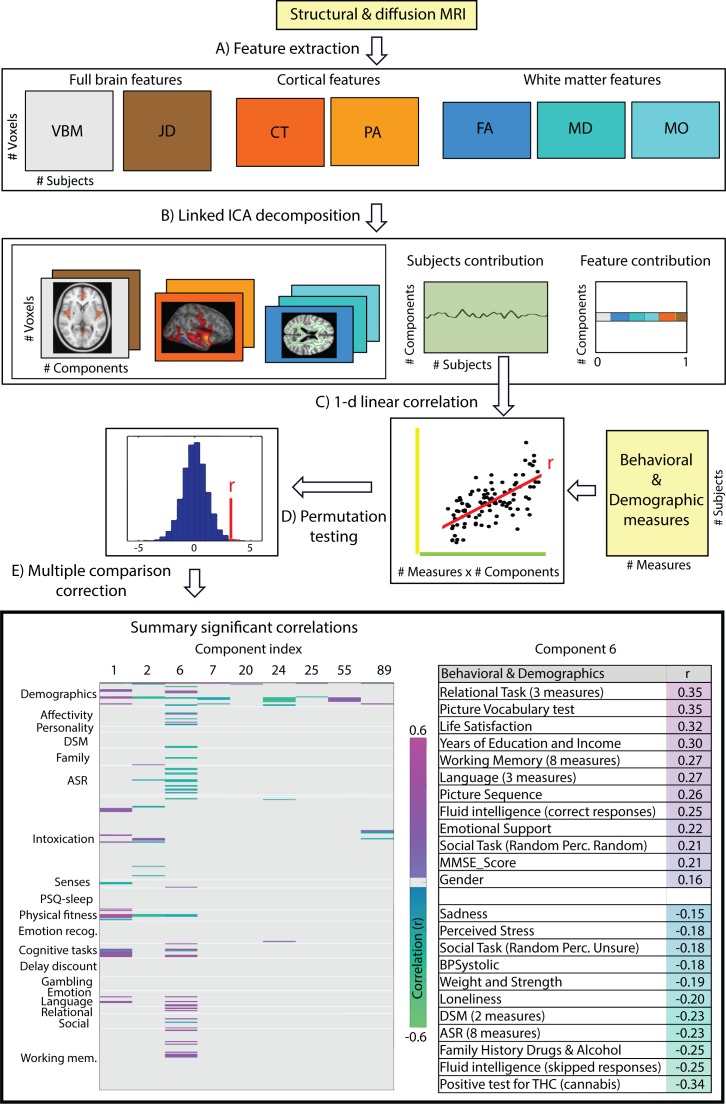
Figure 1. Data processing pipeline and main results.
(A) Structural and diffusion-weighted MRI data are used to extract relevant features, that is, Voxel-Based Morphometry (VBM), Fractional Anisotropy (FA), Mean Diffusivity (MD), Anisotropy Mode (MO), Cortical Thickness (CT), Pial Area (PA) and Jacobian Determinants (JD). (B) These features are used as input to the Linked ICA algorithm. (C) Subject loadings of each independent component are fed together with the behavioral/demographic measures into a correlation analysis. The bottom left panel presents demographic and behavioral measures grouped by categories (y-axis), and a representative set of components reflecting significant correlation with at least one behavioral measure (x-axis). The color-scale encodes the Pearson correlation coefficient and only significant correlations are color-coded. In the bottom right panel, we present a summary of component number six significant correlations to behavioral and demographic variates where the behavioral measures are grouped and ordered according to a decreasing correlation value. These results resemble a mode of structural variation that links to and extends the ‘positive-negative’ behavioral spectrum previously attributed to functional connectivity variations (Smith et al., 2015).

