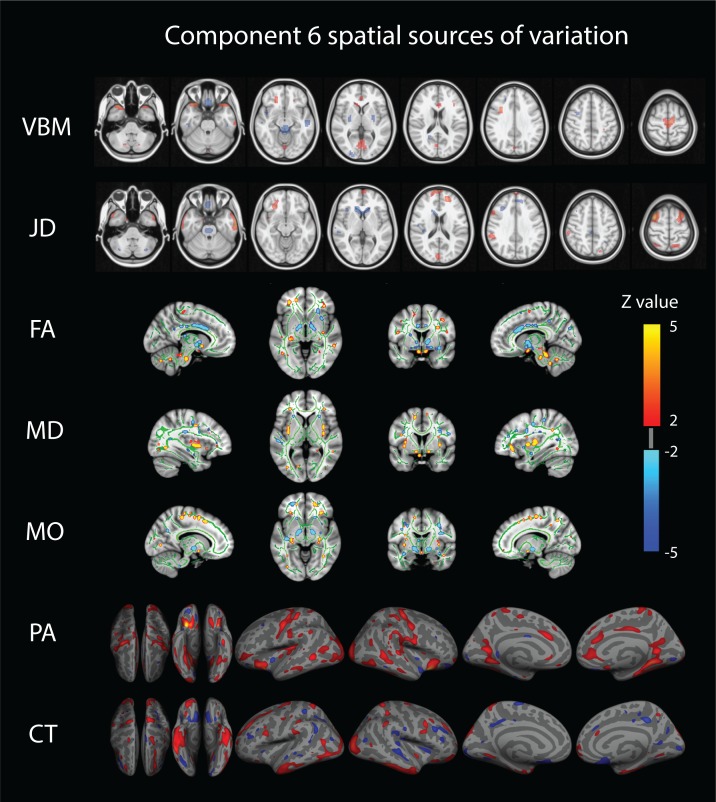
Figure 2. Component number six feature sources of variation.
From top to bottom we visualize the VBM (Voxel Based Morphometry), JD (Jacobian Determinants), FA (Fractional Anisotropy), MD (Mean Diffusivity), MO (Mode of Anisotropy), PA (Pial Area), and CT (Cortical Thickness) spatial maps. For improved visualization, each modality has been thresholded at a z-value of 2. This mode of structural variation, component 6, that strongly reflects a ‘positive-negative’ behavioral spectrum, links to a wide range of brain regions across structural modalities and might reflect the structural multi-modal foundation of a functional brain network linked to these variations that has been earlier identified.

