. 2019 Jun 27;8:e46207. doi: 10.7554/eLife.46207

Figure 5. Vps24/Vps2 form lateral copolymer with Snf7.

(A) Electron microscopy analysis of 10 μM Vps20, 1 μM Snf7 or (Snf7 D13K), 1 μM Vps24 (or Vps24 Q16E) and 1 μM Vps2. Experiments were done on lipid monolayers, with incubation of proteins for 1 hr. Painted lines on the middle-panel are guide to the eye to demonstrate differences in the thickness of the copolymers. The right panel shows hypothetical model of the structures of the polymers made from the different proteins.

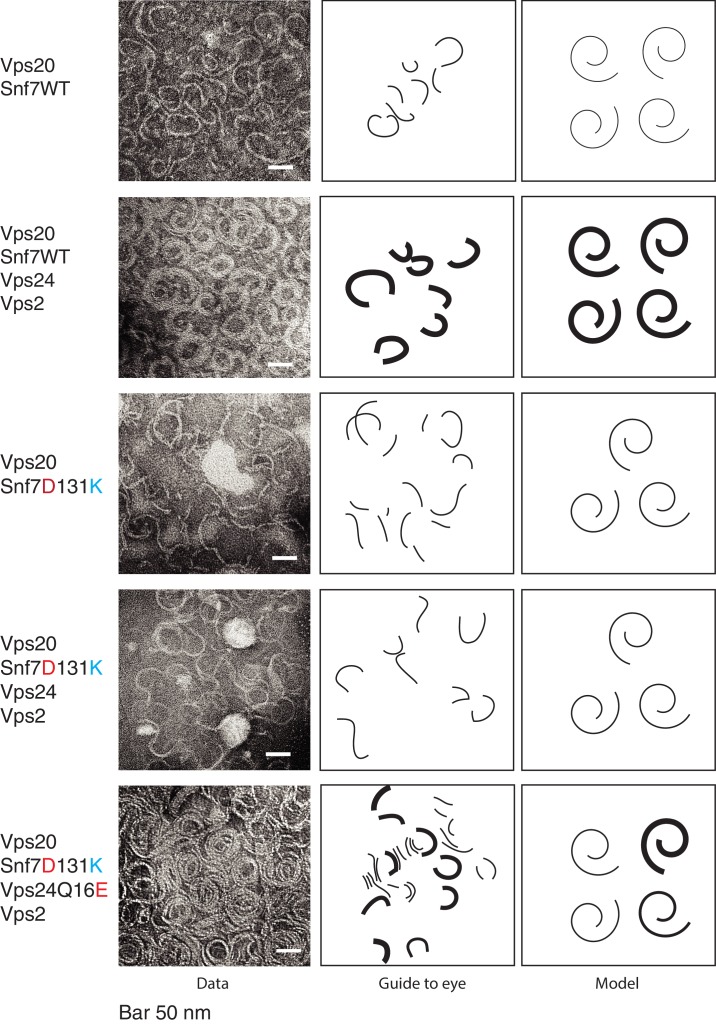
Figure 5.

Figure 5—figure supplement 1. Vps24/Vps2 form 3D helices at higher activation conditions of Snf7.

Figure 5—figure supplement 1.

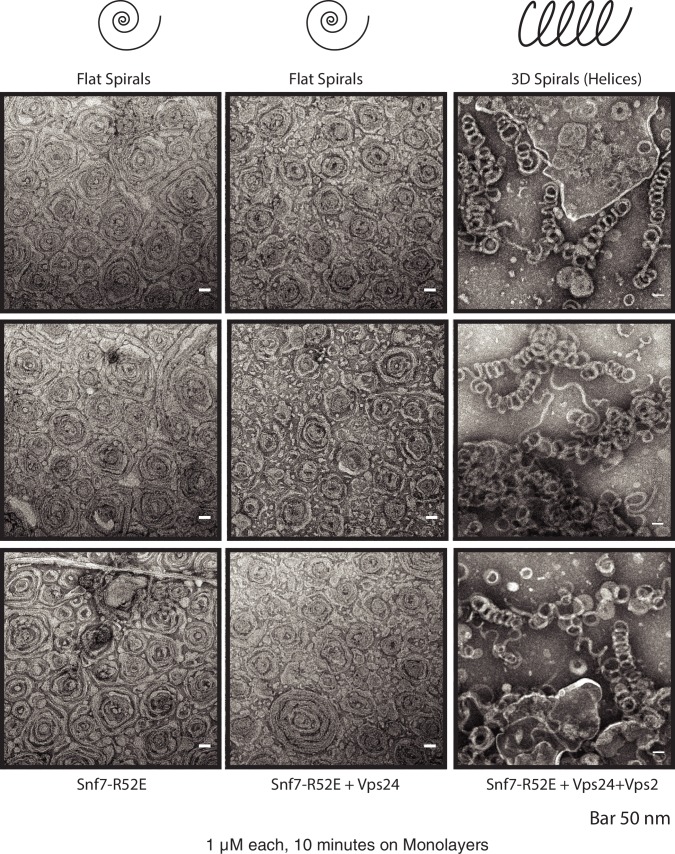
First column depicts spirals of 1 μM Snf7 R52E. Upon addition of 1 μM Vps24 (second column), the spirals remain 2-dimensional. 3D helices form with 1 μM Snf7 R52E, 1 μM Vps24 and 1 μM Vps2 (right column). Three different images of the polymers under each condition are shown. Images were collected after 10 min of incubation on lipid monolayers.
Figure 5—figure supplement 2. Snf7/Vps24/Vps2 form 3D helices at higher activation conditions.

Figure 5—figure supplement 2.

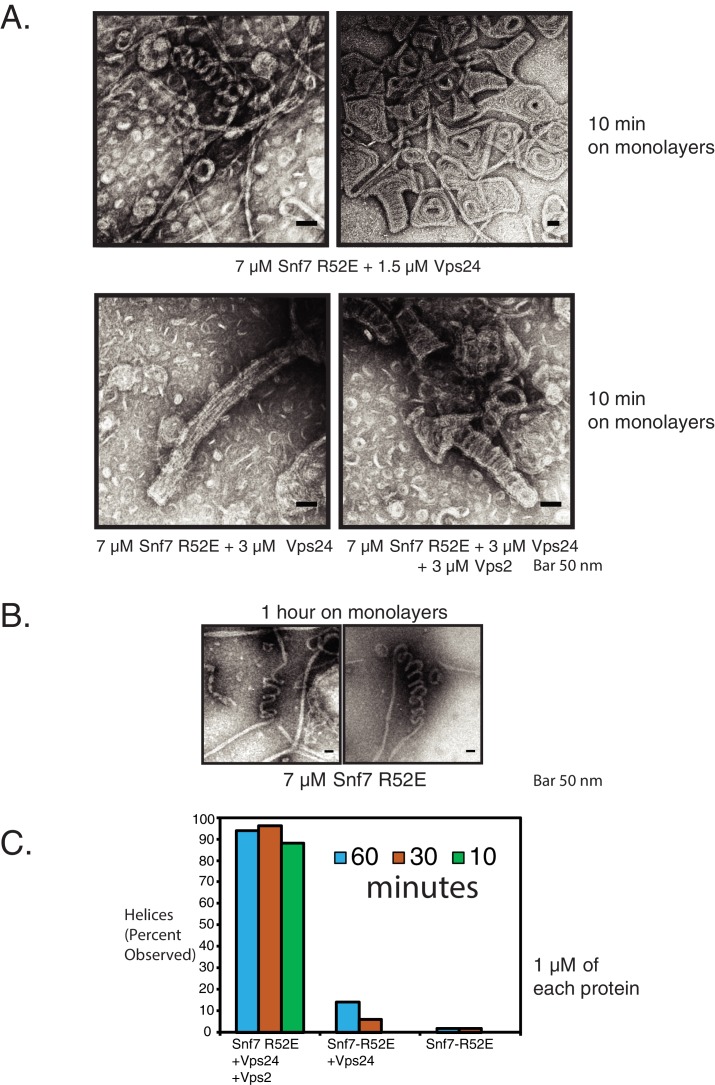
(A) Snf7 R52E and Vps24 form 3D helices of different morphologies at higher concentrations (7 μM Snf7 R52E). Helix formation is more robust with the inclusion of all three proteins (bottom right). (B) ‘Helical’ structures of Snf7 R52E alone, which form at low frequency (Figure 5—figure supplement 2C). (C) Kinetic analysis of the assembly of Snf7 R52E, Vps24 and Vps2 at different concentrations and time. Quantification indicates percentage of images in which helices were observed. Quantification was performed with 50 images under each condition, with images taken at random spots on the grid.
Figure 5—figure supplement 2—source data 1. Snf7/Vps24/Vps2 helices formation is higher when all three proteins are present.
The zip file contains images used to present the quantification in Figure 5—figure supplement 2C. For easy uploading and downloading, the sizes of the images have been downsized by 5.68 fold, using the Adjust size option in ImageJ, constraining the aspect ratio and using the bilinear interpolation option. In the images, 1 pixel equals 4.87 nm.
DOI: 10.7554/eLife.46207.024
Figure 5—figure supplement 3. Snf7 filament progresses into lateral bundles over time.

Figure 5—figure supplement 3.

Electron microscopy images of 500 nM Snf7 R52E protein on lipid monolayers at 5 and 10 min. With 1 μM Snf7 R52E, mostly bundles of polymers are seen at 10 min (right).
Figure 5—figure supplement 4. Snf7 activation allows ESCRT-III helix formation.

Figure 5—figure supplement 4.

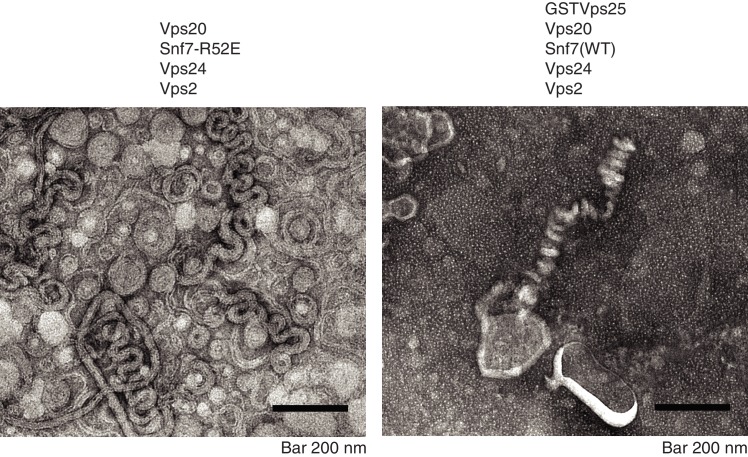
A)Electron microscopy images of 10 μM Vps20, 1 μM Snf7 R52E, 1 μM Vps24 and 1 μM Vps2, incubated for one hour on lipid monolayers. B) Electron microscopy images of 5 μM GST-Vps25, 10 μM Vps20, 1 μM Snf7 (WT), 1 μM Vps24 and 1 μM Vps2, incubated for one hour on lipid monolayers.