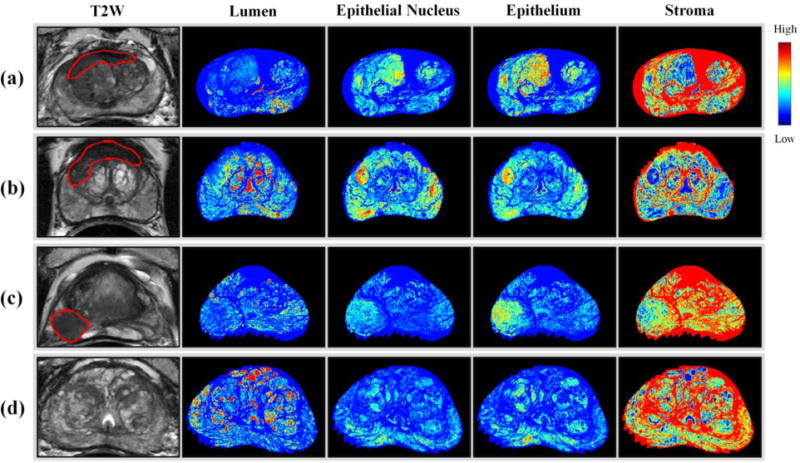
Figure 4.

Density maps for 4 different patients. A density map of tissue components is generated for the whole prostate using tissue segmentation and deformable image registration. Tumor lesions are marked in red. (a)(b) TZ cancer (c) PZ cancer (d) benign.
