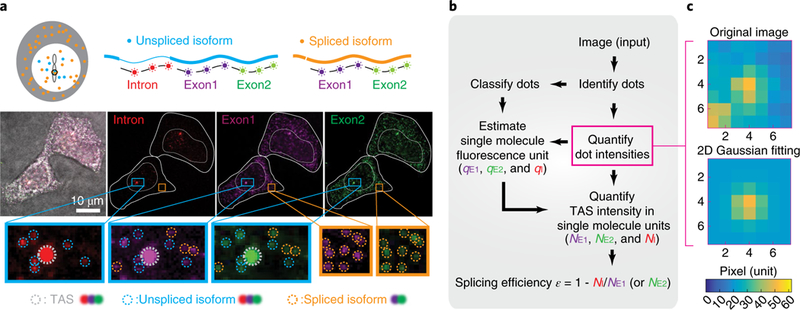
Fig. 2 |. Experimental method for quantifying splicing efficiency at the TAS in individual cells.

a, We designed three smFISH probe sets targeting one spliceable intron (red) and two constitutive exons (purple, green). Sequences of Intron, Exon1 and Exon2 probe sets are listed in Supplementary Table 1. Note that exon probe-set numbering does not match exon numbering. In this image of two cells, staining by each probe set is shown in the corresponding color channel, superimposed on a brightfield image (grayscale). Identified smFISH dots are circled in the zoomed insets, with TAS in gray, unspliced isoform (dots co-localized in Intron, Exon1 and Exon2 channels) in blue and spliced isoform (dots co-localized in Exon1 and Exon2 channels) in orange. b, Workflow for quantifying NE1, NE2 and NI, the number of transcripts observed within the TAS in the exon 1, exon 2 and intron channels using corresponding single-molecule fluorescence units, qE1, qE2 and qI, respectively (see also Supplementary Fig. 1a). c, Iterative fitting of individual dot intensities. Using a method from stellar photometry of crowded star fields, we iteratively remove fluorescence from adjacent dots to produce a single-dot image (bottom) from an initial image with multiple dots (top) (see Supplementary Note 1 and Supplementary Fig. 1c for more detail). Source data are available online.
