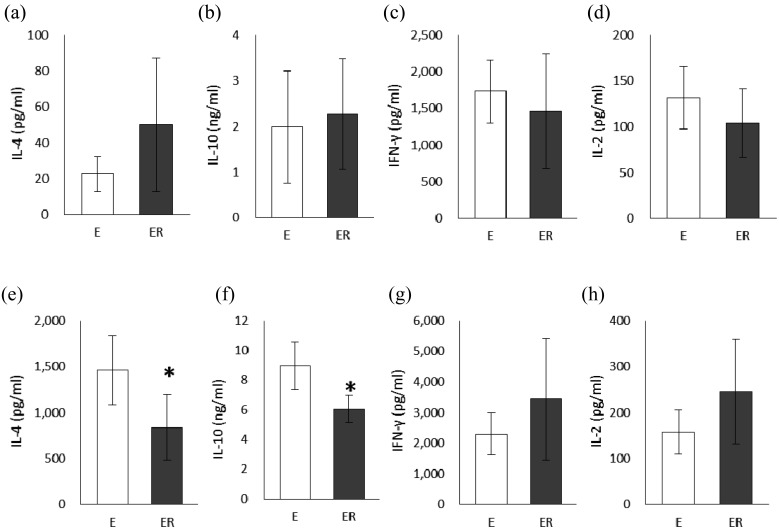
Fig. 3.
Cytokine production from mesenteric lymph node cells (a–d) and splenocyte (e–h) in OVA23-3 mice fed ovalbumin with or without RMD for 9 days. (a, e) IL-4, (b, f) IL-10, (c, g) IFN-γ, (d, h) IL-2.
White bars indicate group E (egg white) and gray bars indicate group ER (egg white + RMD). Values are means ± SD (n=5–6). An asterisk indicates a significant difference between the two groups (p<0.05).

