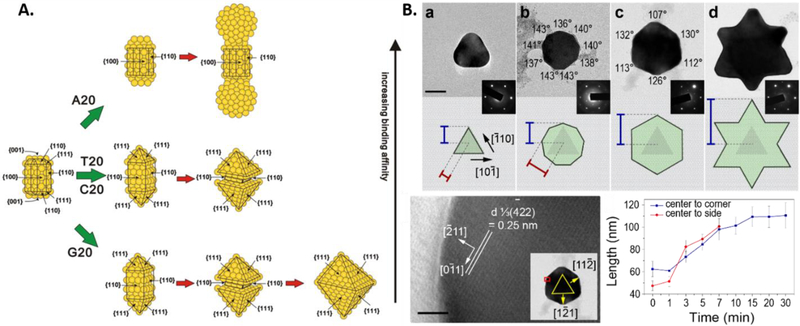
Figure 5.
A). Schematic representing the overgrowth of Au nanorod seeds in the presence of DNA. The facets of the seed play an important role in the DNA binding events. (Reproduced with permission.[84] Copyright 2015 Wiley-VCH). B). The growth progression of the Au nanoprism in the presence of T30, starting from (a) nanoprism to (b) nonagon to (c) hexagon to a final (d) six-pointed star with corresponding model of the NP and diffraction pattern (insets). Blue and red lines on the models indicate the distance measured from the center to the corners or sides of the particles, respectively, plotted in the bottom right corner. HR-TEM image of the hexagonal. Scale bar is 2 nm. Red box shows the location where the higher-resolution image was observed. (Reproduced with permission.[104] Copyright 2015 American Chemical Society)

