
Figure 1.
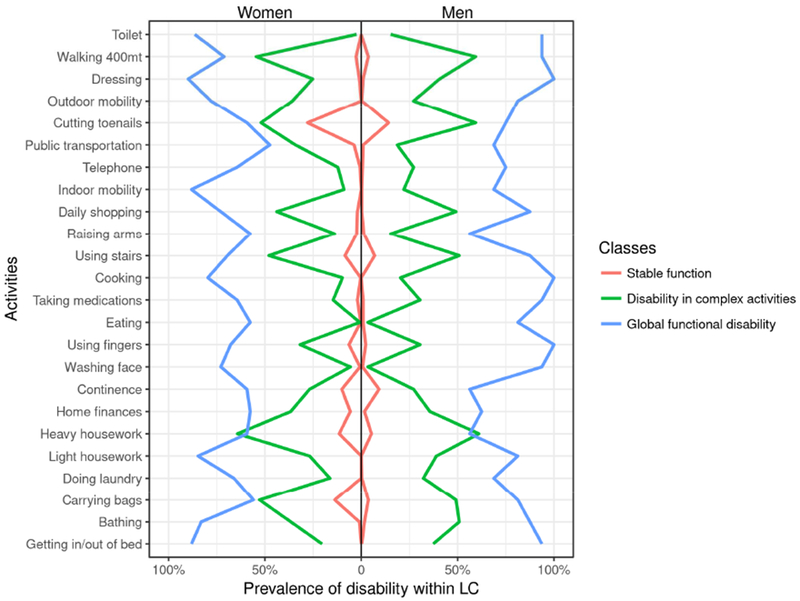
Proportion of disability in each functional task, in women and men, according to the classes obtained by latent class analysis.
The lines represent the proportion of people developing individual disabilities within each latent class. LC: latent class