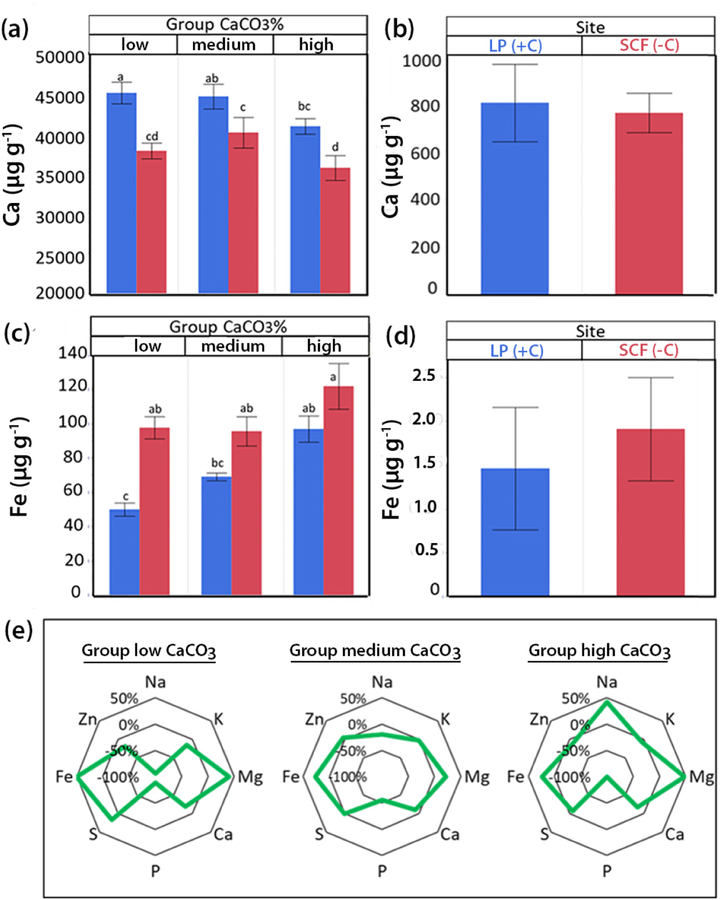
Figure 3.
Ionomics of rosette leaves of A. thaliana demes at both experimental sites, (SCF) with siliceous soil (−C) (red) and Les Planes (LP) with calcareous soil (+C) (blue); demes were classified into three groups according to low, medium, or high soil CaCO3 contents in their natural habitat. Ca concentrations (μg g−1 dry weight) in rosettes (a) and experimental field soil (b); Fe concentrations (μg g−1 dry weight) in rosettes (c) and experimental field soil (d). Values are means from three years ±SE, (n = 30; p<0.05; ANOVA; Tukey HSD). Percent differences for 8 selected elements (green line) (e) between plants grown at SCF (−C) and LP (+C); plants divided into three groups according to the carbonate content in their native soils.

