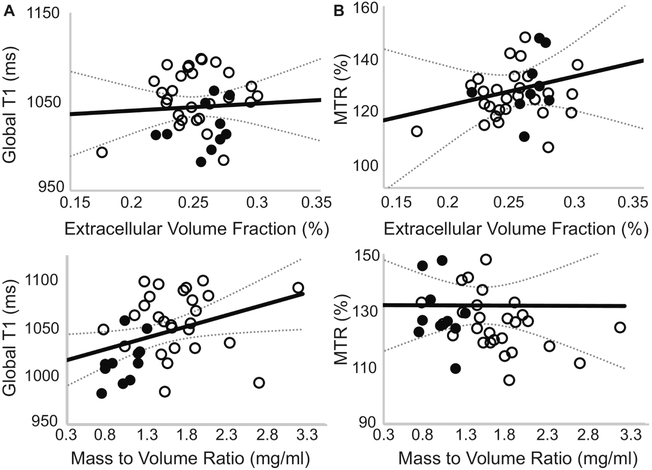
Fig. 3. Association of global native-T1 or MTR with global extracellular volume fraction and left ventricular mass to volume ratio.
Healthy controls are represented by filled circles, diabetic adults are represented by empty circles. (A) The average global left ventricular native-T1 time was not correlated with ECV (Pearson’s ρ = 0.06, P = 0.73) derived from pre- and post-contrast T1 times. (B) Similarly, the average left ventricular magnetization transfer ratio (MTR) was not correlated with ECV values (Pearson’s ρ = 0.15, P = 0.38). (C) In contrast, a significant correlation was observed between native-T1 and the left ventricular MVR (Pearson’s ρ = 0.36, P = 0.025). (D) No correlation was observed between the magnetization transfer ratio and the MVR (Pearson’s ρ = 0.07, P = 0.67).

