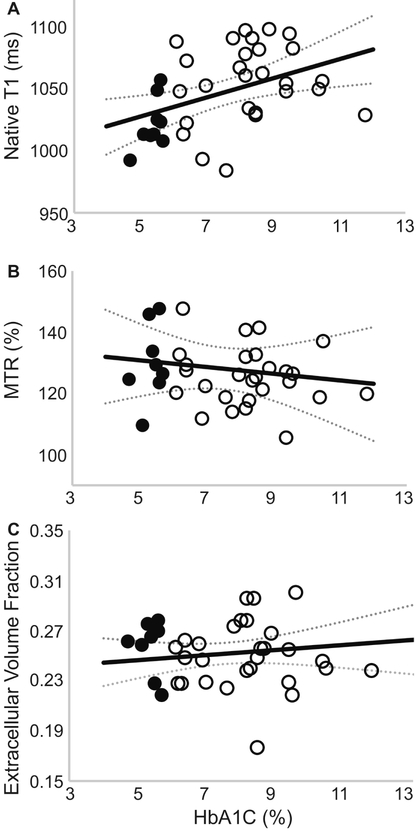
Figure 5. Global average native-T1 relaxation time is strongly correlated to plasma HbA1c at the time of imaging.
(A) A significant correlation (Pearson’s ρ = 0.43, P = 0.0088) was observed between native-T1 relaxation times and corresponding plasma HbA1c measurements. In contrast, neither (B) MTR (Pearson’s ρ = 0.10, P = 0.56) nor (C) ECV (Pearson’s ρ = 0.14, P = 0.41) correlated with plasma HbA1c values.

