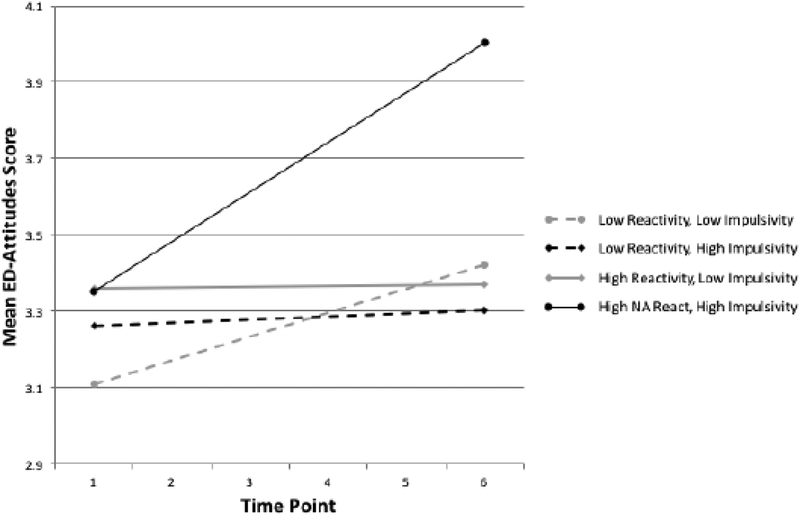
Figure 2. Graph of the linear trajectories of ED-attitudes for high and low negative affect reactivity and impulsivity groups.
Note. Groups were created by dividing the sample at the mean of both the Eysenck Impulsivity Scale and the Negative Affect Reactivity measure. Lines represent trajectories rather than point estimates to better capture growth over time and parallel reported analyses. *p < 05, **p < 01.

