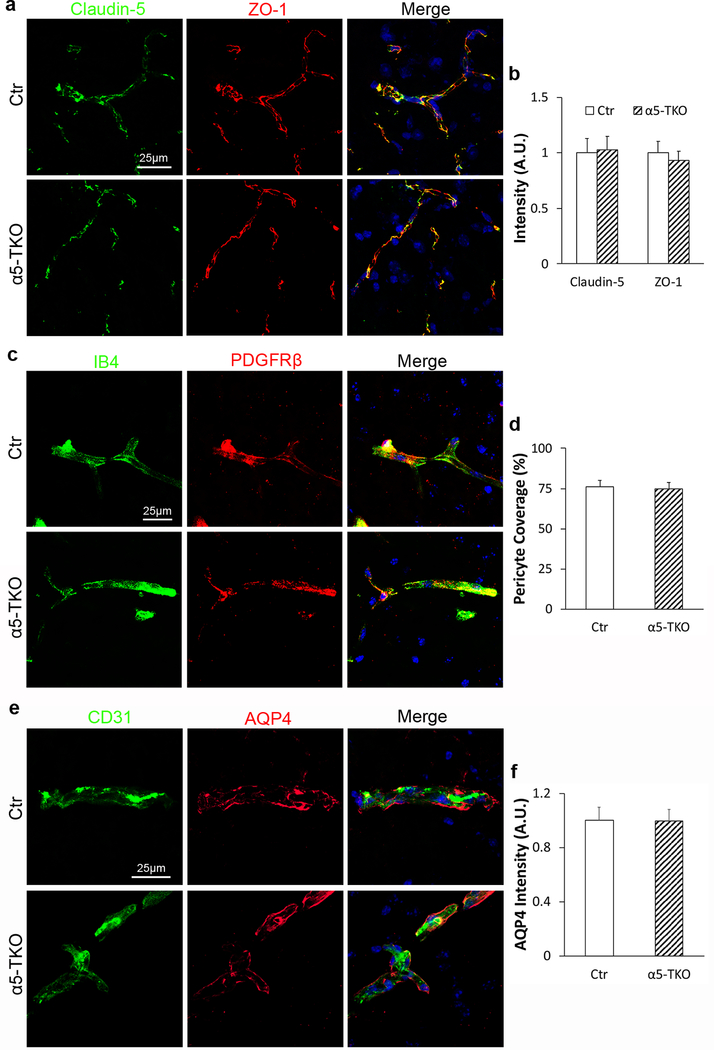
Fig. 3.
α5-TKO mice show no defects in TJP expression, pericyte coverage, and astrocyte polarity. a Representative images of Claudin-5 (green) and ZO-1 (red) staining in control and α5-TKO brains. b Quantifications of Claudin-5 and ZO-1 intensity in the brains of these mice. n=4. Student’s t-test was used for statistical analyses. c Representative images of IB-4 (green) and PDGFRβ (red) staining in control and α5-TKO brains. d Quantification of pericyte coverage in the brains of these mice. n=4. Student’s t-test was used for statistical analyses. e Representative images of CD31 (green) and AQP4 (red) staining in control and α5-TKO brains. f Quantification of AQP4 intensity in the brains of control and α5-TKO mice. n=4. Student’s t-test was used for statistical analyses.

