
Figure 4.
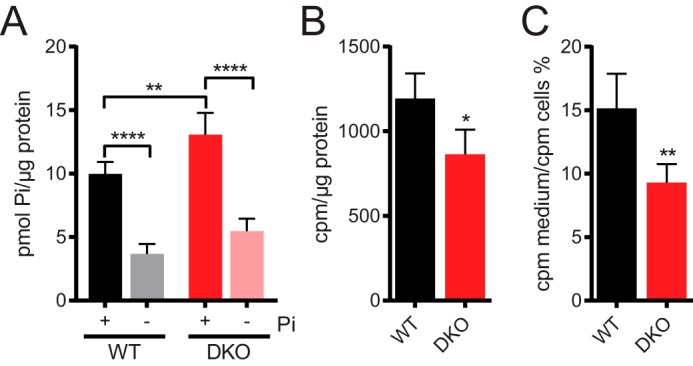
Altered phosphate homeostasis in DKO cells. A, cells were grown in 0.9 or 0 mm phosphate for 24 h before determination of intracellular free phosphate using Malachite green assay. B, cells were pulse labeled with [32Pi] for 20 min, then intracellular [32Pi] was counted using a β-counter. Results were normalized to protein concentration from untreated control wells. C, cells were pulse labeled with [32Pi] for 20 min, washed, and incubated in unlabeled medium for 30 min. Counts for media samples were normalized by cells counts. Labeling experiments with [32Pi] were performed in media containing 0.9 mm phosphate. Data in B and C show mean ± S.D. from 4 experiments. *, p < 0.05; **, p < 0.01, t test. Chart in A shows mean ± S.D. from 5 experiments. **, p < 0.01; ****, p < 0.0001, ANOVA with Tukey post test. No significance was found between 0 mm phosphate-starved WT and DKO cells. Pi = phosphate.