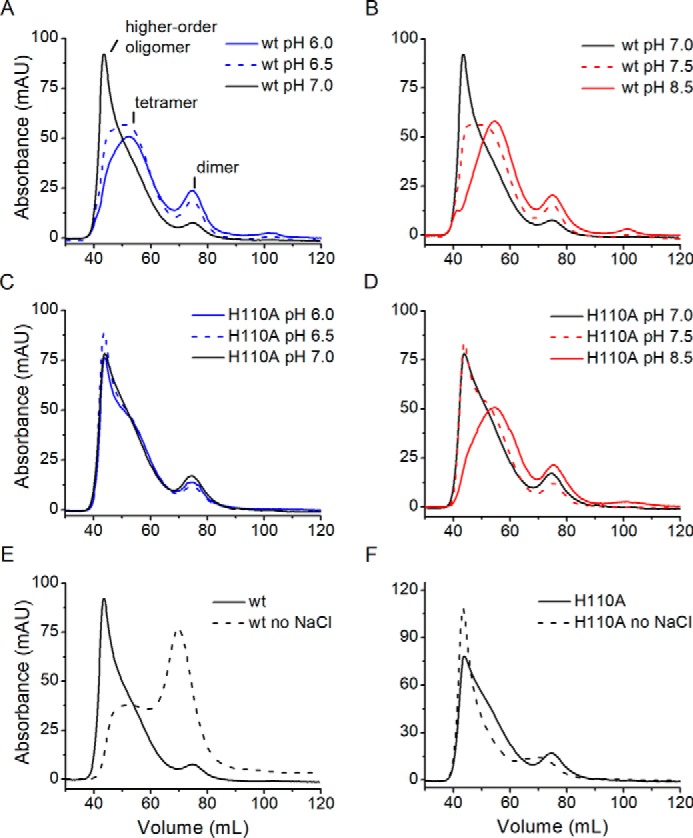
Figure 5.

Effect of pH and ionic strength on ACMSD oligomeric state distribution. Representative separation profiles of wtACMSD (A and B) and H110A (C and D) under pH 6.0 (blue line), pH 6.5 (blue dashed line), pH 7.0 (black line), pH 7.5 (red dashed line), and pH 8.5 (red line). E and F, separation profiles of wtACMSD and H110A under pH 7.0 with (black line) and without (black dashed line) the addition of NaCl. mAU, milli-absorbance units.
