Figure 6.

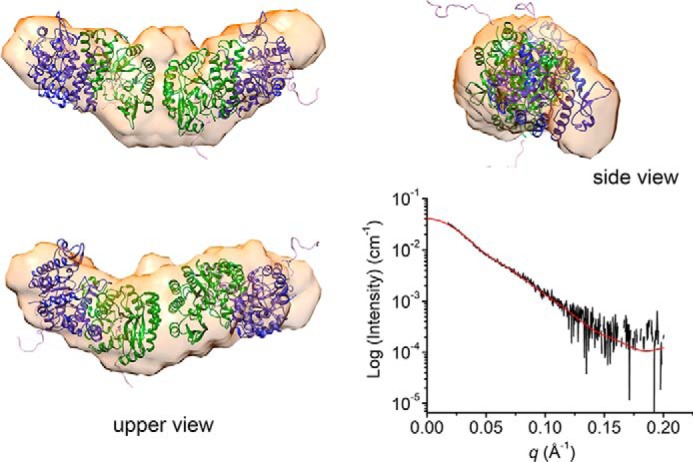
An ab initio model of H110A derived from the SAXS profile fitted with a CORAL model (most populated volume). Red line, back-calculated scattering curve of the CORAL model.

An ab initio model of H110A derived from the SAXS profile fitted with a CORAL model (most populated volume). Red line, back-calculated scattering curve of the CORAL model.