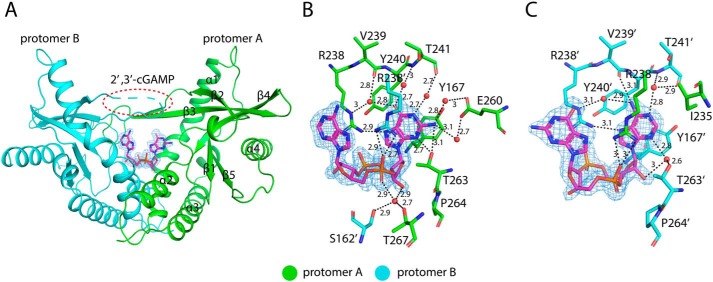
Figure 3.
Structure of porcine STINGCBD in complex with 2′,3′-cGAMP. Protomers A and B are colored green and cyan, respectively. The black dashed line represents the hydrogen bond formed between ligand and protein. The values indicate the length of hydrogen bond with the unit of Å. The waters are shown as red sphere. The ligand is shown as a stick model colored in magenta. The simulated annealing omit Fo − Fc electron-density map for 2′,3′-cGAMP (blue mesh) is contoured at 3 σ. A, overall structure of porcine STINGCBD–2′,3′-cGAMP complex (side view). The red dashed circle shows the disordered lid region in protomer B. B, detailed interactions between GMP(2′,5′) moiety of 2′,3′-cGAMP and G site of STING protein. C, detailed interactions between AMP(3′,5′) moiety of 2′,3′-cGAMP and A site of STING protein.

