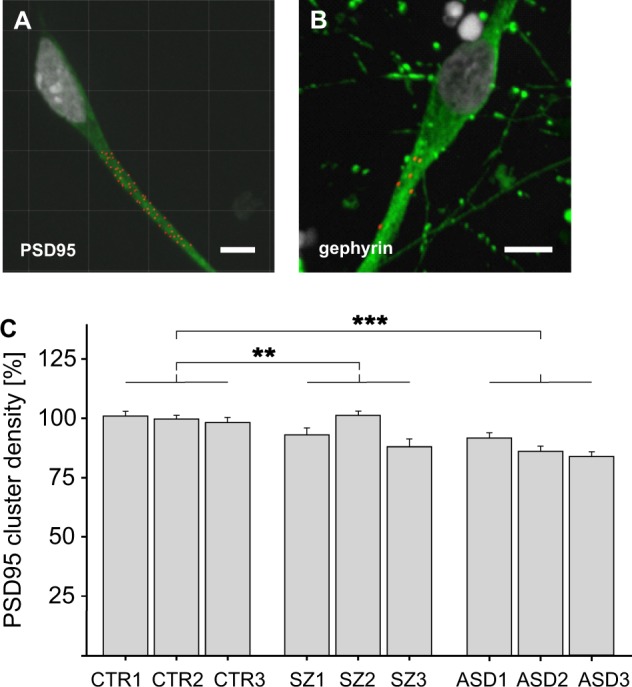
Fig. 2. Expression of differentiation markers in hiPSC-derived neurons.

a, b Immunostaining for PSD95 or gephyrin clusters, respectively. PSD95 or gephyrin clusters are indicated in red while neurons were stained for β-III-tubulin in green. Scale bar 10 µm. c Determination of PSD95 cluster density on 20 µm segments on β-III-tubulin-positive neurites. For each of the three individuals of each group (healthy CTR1-3, SZ1-3, and ASD1-3), one clone was tested in at least six independent differentiations. Within one experiment all donors were normalized to CTR1. For a group comparison, mean PSD95 cluster density of all donors of each group was calculated and compared with the other groups. Kruskal–Wallis Test and Dunn’s post hoc test, H(2) = 62.98; **p < 0,01; ***p < 0,001; n = 360 for each group, error bars are s.e.m.). Data were collected from three independent experiments
