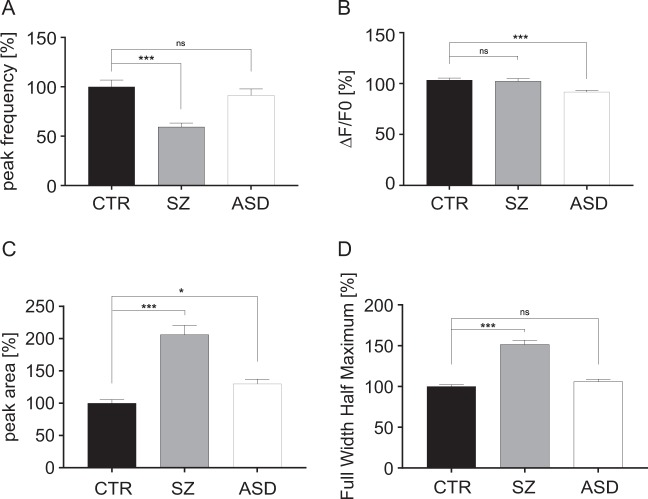
Fig. 4. Measurement of calcium signals.
Cal-520®-stained neurons of healthy control, schizophrenia, and autism groups were imaged for 10 min and signals obtained were used to calculate peak frequency (a), peak amplitude (b), peak area (c), and full width half maximum (d). Fluorescence intensity ΔF/F, frequency, and length of events were analyzed using Fiji and Origin software; Kruskal–Wallis Test and Dunn’s post hoc test, peak frequency H(2) = 22.56, ΔF/F0 H(2) = 19.44, peak area H(2) = 93.17, and FWHM H(2) = 45.2; *p < 0.01; ***p < 0.0001; for each group, error bars are s.e.m.

