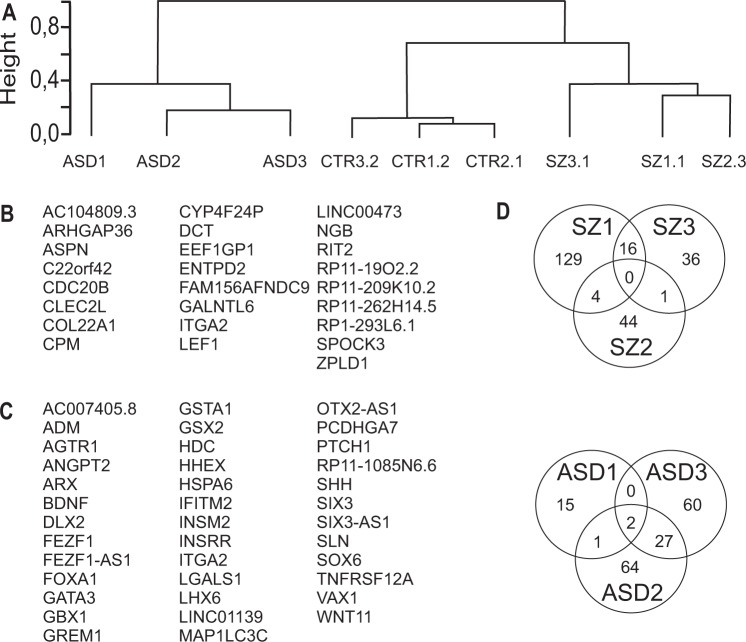
Fig. 5. Transcriptome sequencing shows discrimination of disease groups.
a Hierarchical clustering based on similarity of expression data (Spearman’s rank correlation coefficient) of deregulated genes in a one group comparison. b, c List of jointly enriched genes after comparison of the group of the three control and the three donors with SZ (b) or ASD (c), one clone per patient. d Heterogeneity within the schizophrenia and ASD cohort. Analysis of the transcriptome of individual schizophrenia samples with the group of the three healthy control samples. The Venn diagram depicts the number of individually and commonly deregulated genes in the three SZ and the three ASD samples, respectively

