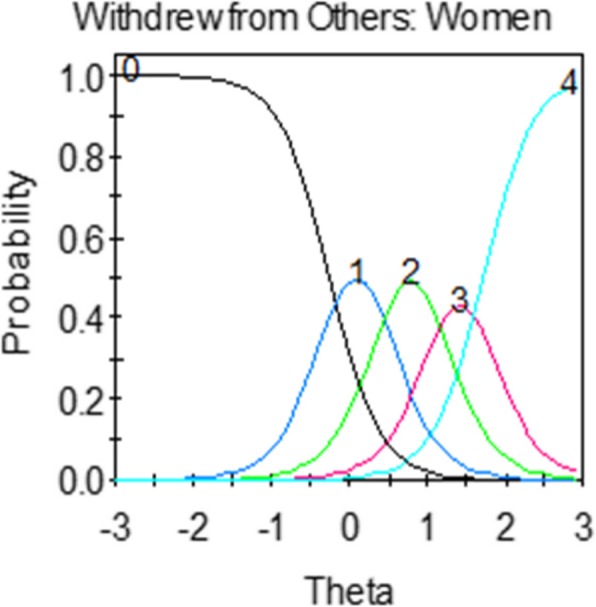
Fig. 1.

Example of an item characteristic curve (ICC) or “trace line”. Vertical axis: probability of endorsement for each response category; Horizontal axis: theta (level of latent trait, e.g., level of depressive symptoms). Response option choices: 0: Never; 1: Rarely; 2: Sometimes; 3: Often; 4: Always
