Fig. 3.

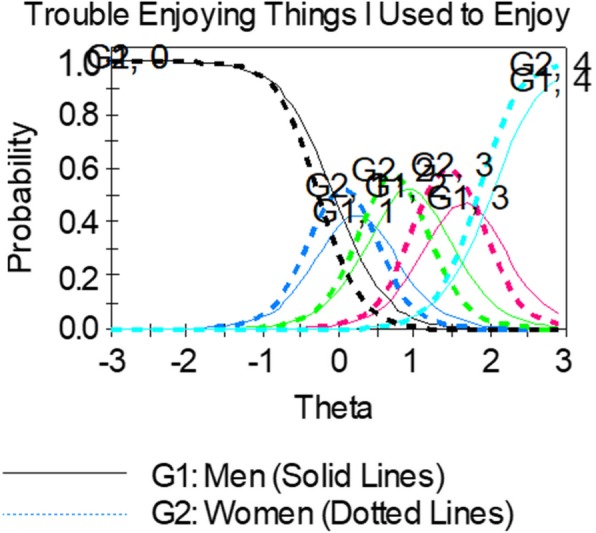
Example of an item showing uniform b-DIF. Women (dotted lines) consistently endorsed higher levels of depression (their curves are shifted to the left of men in every response category)

Example of an item showing uniform b-DIF. Women (dotted lines) consistently endorsed higher levels of depression (their curves are shifted to the left of men in every response category)