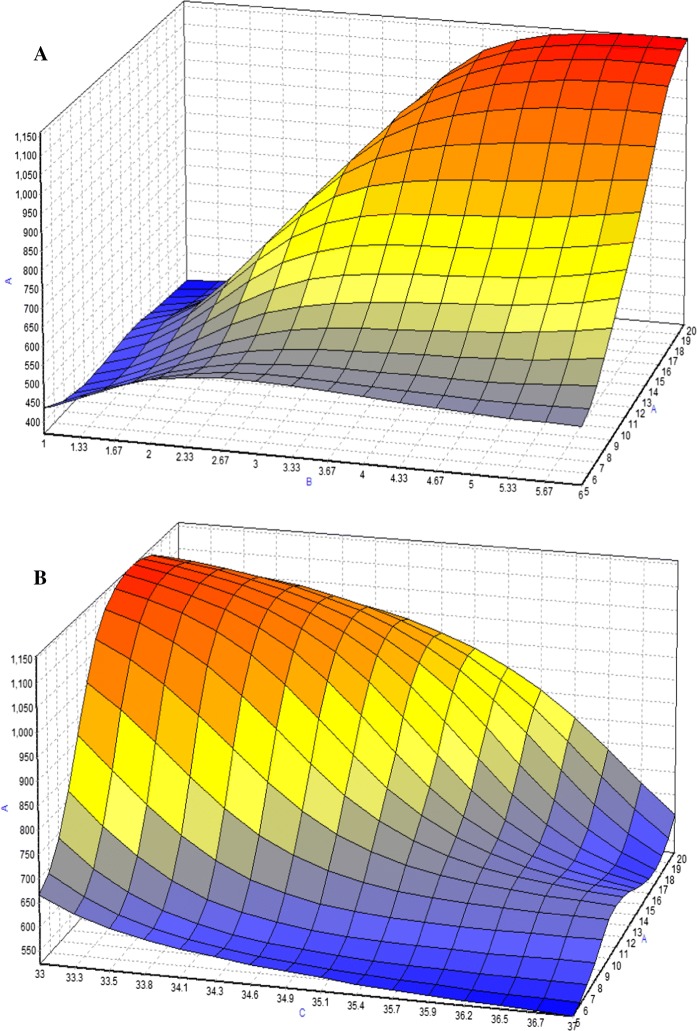
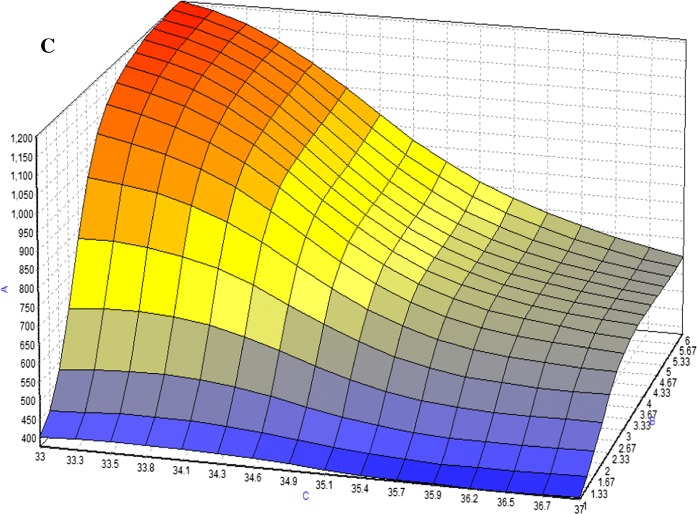
Fig. 4.
3D plots for combined effect of a FBS concentration and cultivation time b FBS concentration and temperature c cultivation time and temperature on the production of mAb (y-axis) in DMEM medium. The symbols indicated in the graph were a is FBS concentration; b is cultivation time and c is temperature. Color from red to blue indicated maximum to minimum production of McAb


