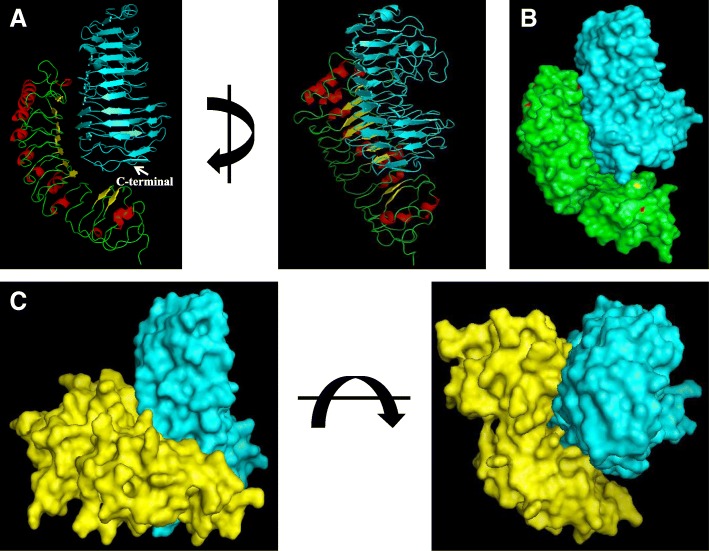
Fig. 2.
Comparative analysis of OsPGIP1-RsPG1 and OsPGIP2-RsPG1. a, Cartoon representation of the complex formed by OsPGIP1 (red and yellow) and RsPG1 (cyan blue). Two orthogonal perspectives are shown. b, Surface representation of the complex formed by OsPGIP1 (green) and RsPG1 (cyan). c, Surface representation of the complex formed by OsPGIP2 (yellow) and RsPG1 (cyan). Two orthogonal views are shown.

