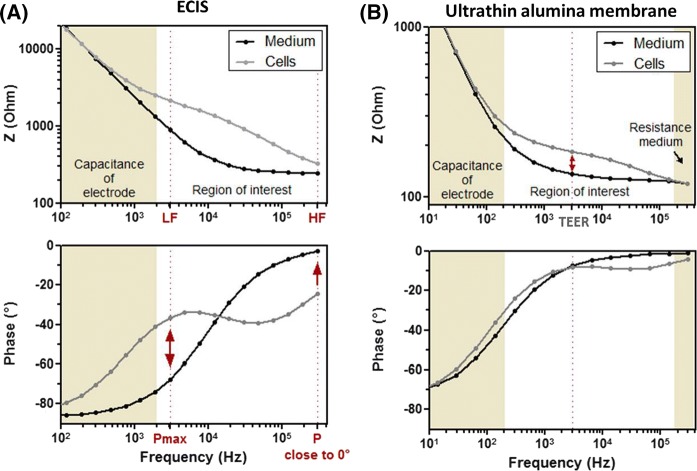
Fig. 1.
Impedance spectra and corresponding phase angle of a high density cell culture on electric cell substrate for impedance sensing (ECIS) and on ultrathin alumina membranes. Impedance (Z) and phase angle are plotted against the frequency and show typical profiles for cell containing and cell-free a ECIS chips and b ultrathin alumina membrane chips. Z spectra are mainly dominated by the electrode capacitance in the low frequency range, while the region of interest provides information about the electrical properties of the cells. For ultrathin alumina membranes the Z spectrum is additionally characterized by the dominating resistance of the medium at the higher frequency range. The phase informs about the resistive (→ 0°) or capacitive (− 90°) character of the system and can be used to determine a low frequency (LF) and a high frequency (HF) within the ECIS system by selecting the maximal phase angle difference (Pmax, before curves are crossing) and the phase indicating a resistive character of the system (P close to 0°). For alumina membranes the phase can be used to determine the optimal frequency for transepithelial electrical resistance (TEER) measurements, which normally correlates with the crossing phase angle curves

