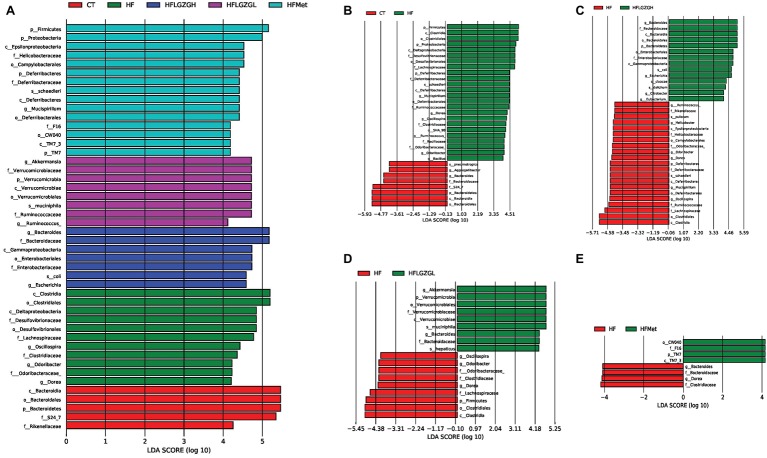
Figure 7.
Contribution of gut microbiota to differences among groups. Linear discriminant analysis (LDA) scores of the taxa with significant differences, ranked according to effect size. Discriminant analysis effect size (LEfSe) analysis was applied; taxa with an LDA score > 4 and p < 0.05 determined by the Wilcoxon signed-rank test are shown in the Figure. (A) Histogram of LDA score comparison among groups. (B–E) Histogram of LDA score comparison between the intervention group and the HF diet control group. Mice were fed a chow diet (CT), a high-fat diet (HF), a high-fat diet and metformin (HF + Met), a high-fat diet and a high dose of Linggui Zhugan (HF + LGZGH), or a high-fat diet and a low dose of Linggui Zhugan (HF + LGZGL) for 8 weeks. There were seven mice in the HF + LGZGH group and six mice in each of the other groups.

