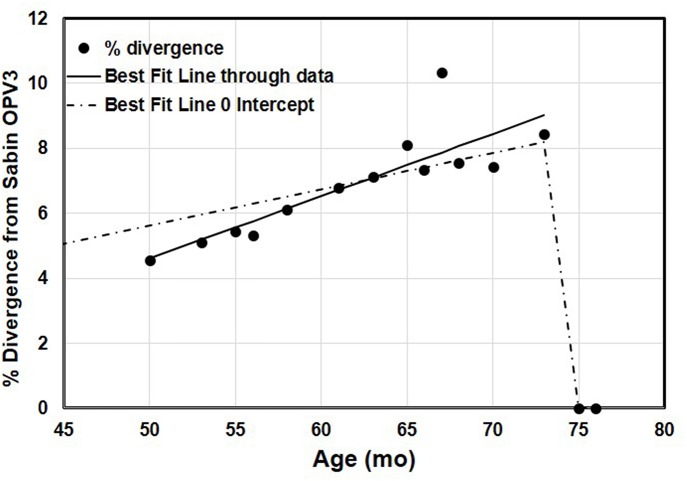
Figure 1.
The accumulation of changes in the VP1 genomic region of 13 sequential poliovirus type 3 isolates under study. The actual observed data and the variability of the repeated measurements over the time of observation have been indicated. The data were adjusted to linear functions for the accumulation of substitutions. The two lines show the best-fitting linear trend to the observed positive data with and without an intercept. The line with no intercept implies infection at the time of birth, because it goes through 0% divergence at age 0. The better-fitting line with the intercept shows a steeper increase in divergence. Regression with intercept: equation for the line: estimated % divergence while excreting Y = 0.112 x, x = age (months), Y = estimated % divergence, R2 = 0.85. Regression without intercept: equation for the line: estimated % divergence while excreting Y = 0.192x – 5, where x = age (months), Y = estimated % divergence, R2 = 0.99.

