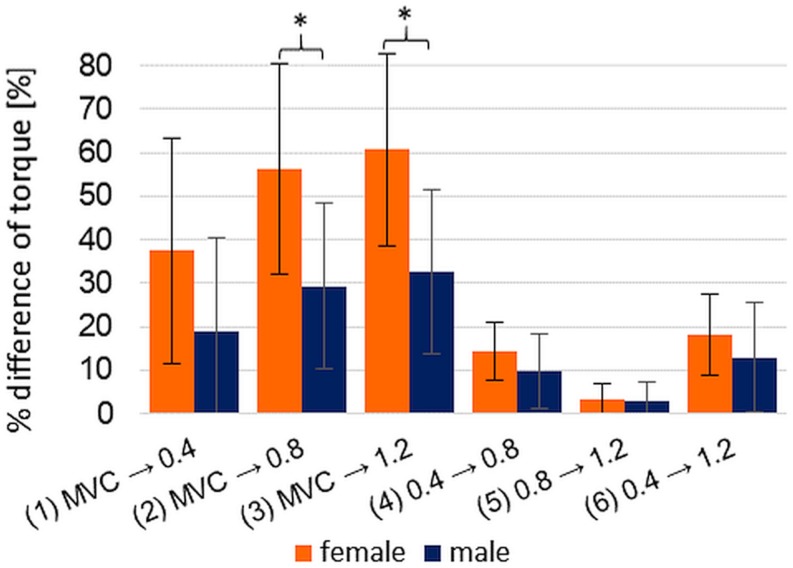
FIGURE 7.
Displayed are the gender specific arithmetic means (±SD) of the percentage difference of each torque comparison: MVIC to xpAFeccmax per pre-pressure 0.4 bar (1), 0.8 bar (2), and 1.2 bar (3), respectively, and xpAFeccmax compared within the pre-pressure levels [0.4 → 0.8 bar (4), 0.8 → 1.2 bar (5), 0.4 → 1.2 bar (6)]; The comparisons between male and female (each n = 10) show partly significant differences: *p = 0.005.

