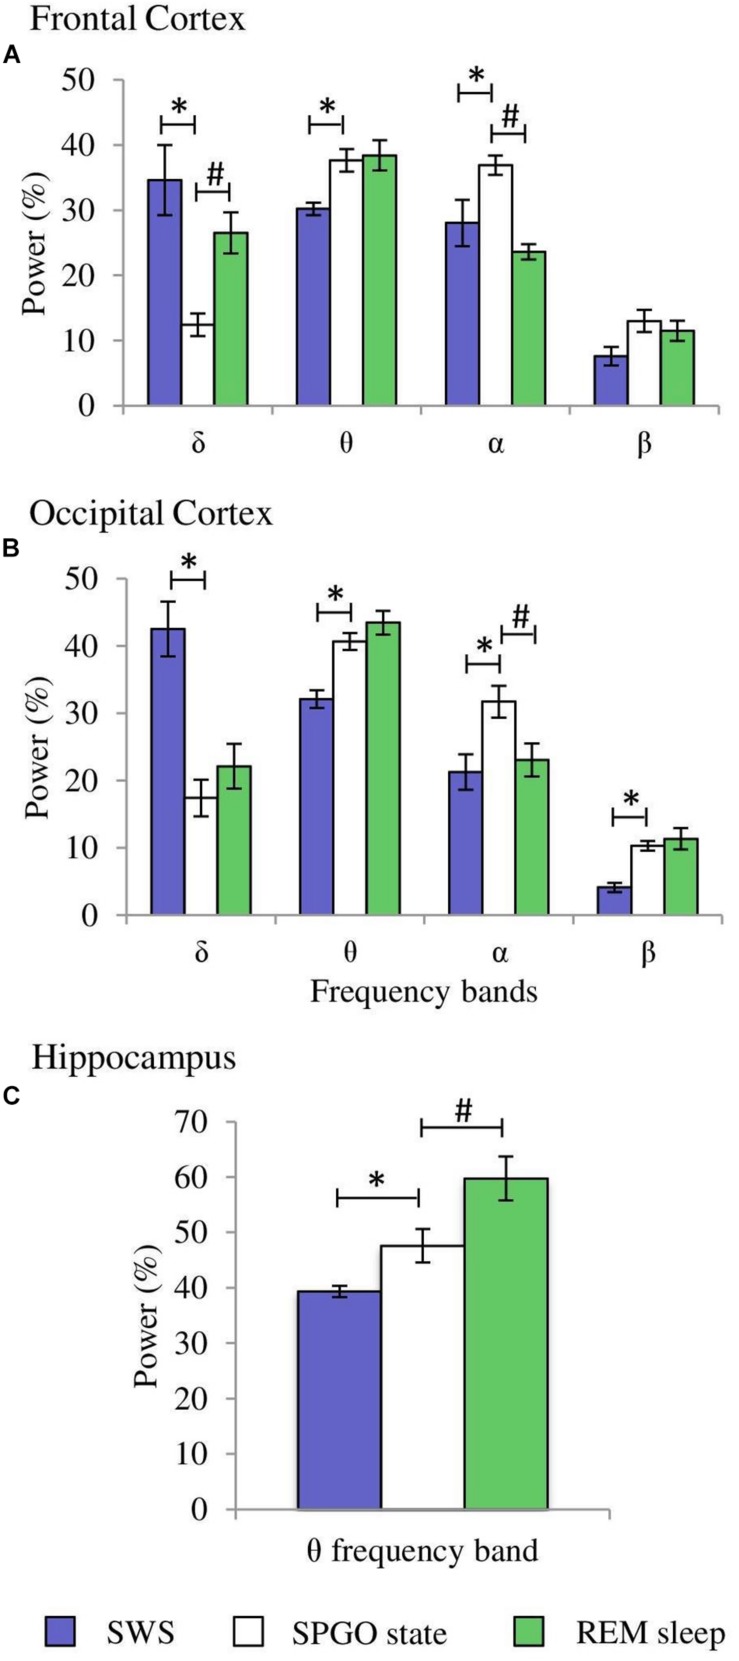
FIGURE 7.
Comparisons of normalized power values for the different EEG frequency bands between the SPGO state, SWS and REM sleep. Each bar represents the average percentage value and the standard error of each EEG band relative to the total power (1.5–20 Hz) from 1-min epochs in the different states. (A) Frontal cortex, (B) occipital cortex, and (C) hippocampus (n = 7 cats). Values for the SPGO state are the mean ± standard error from the three successive 1-min epochs (20 min apart) obtained from each animal after 20–30 nl 0.01 M carbachol in the PLCα. *Statistically significant differences between the SPGO state and SWS. #Statistically significant differences between SPGO state and REM sleep. Post hoc analyses (Fisher’s test, p = 0.05).

