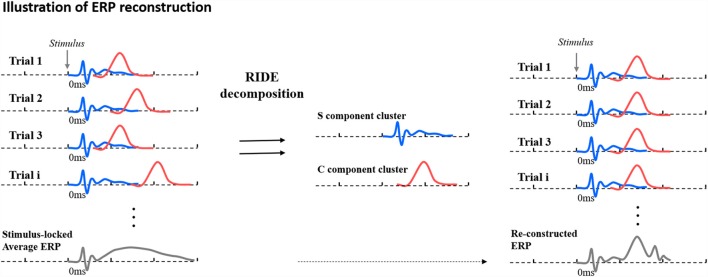
Figure 3.
Schematic illustration of conventional stimulus-locked average Event Related Potential (ERP) (left) from single trials with latency jitter, decomposition byResidual Iteration Decomposition Analysis (RIDE; middle) and reconstructed ERP after correcting for latency variability (right). The S component is shown as a blue waveform and the C cluster as a red waveform. Figure is adapted from Ouyang et al. (2016).

