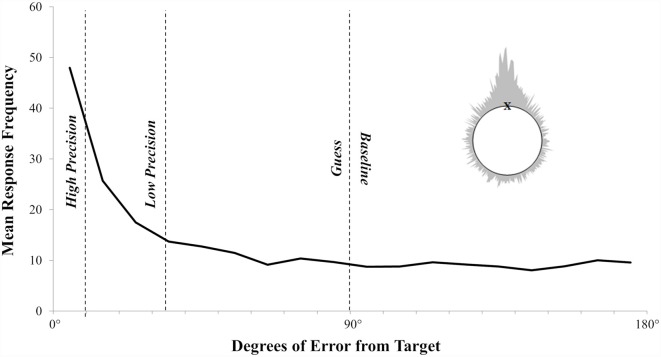
Figure 4.
The observed error distribution clearly shows a mixture of thresholded recollection with responses clustering around the target and sub-thresholded guessing that is uniformly distributed above zero. The dashed lines represent the division of ERP bins. Inset is the wrapped distribution of errors from both the left and right side of the target.

