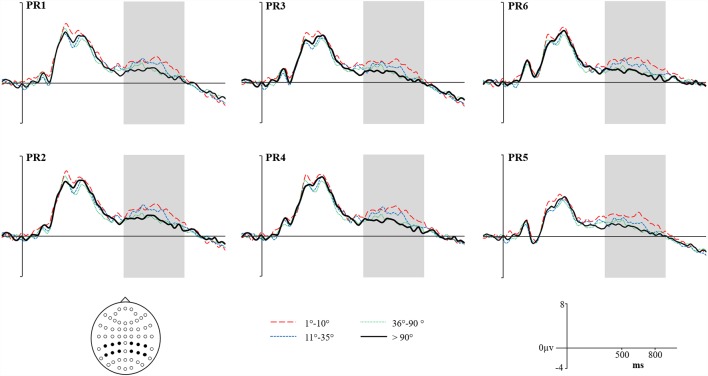
Figure 5.
Grand average ERPs for High Accuracy responses (1°–10°) shown as a red dashed line, Low Accuracy responses (11°–35°) shown as a blue dashed line, Guess responses (36°–90°) shown as a Green dotted line, and Baseline (over 90°)—shown as a solid black line. Representative electrodes are shown over the left Parietal Region (PR; top row: PR6, PR3, PR1) and right PR (bottom row: PR6, PR4, PR2). Inset is the schematic map of the 62 recording electrodes—with those representative electrodes represented as black dots.

