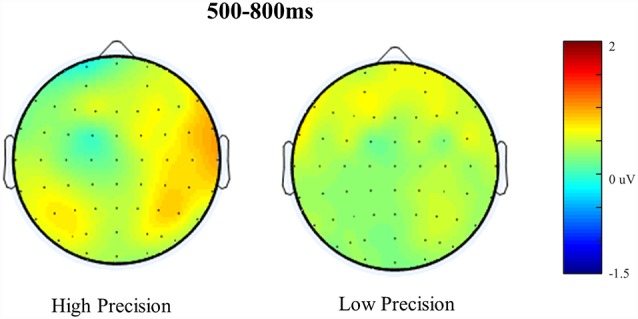
Figure 6.

Scalp maps illustrating old/baseline distributions for High Accuracy and Low Accuracy responses during the 500–800 ms time window. Each map is shown as if looking down on the head with frontal sites pointing towards the top of the page. The scale bar indicates the voltage range (μV).
