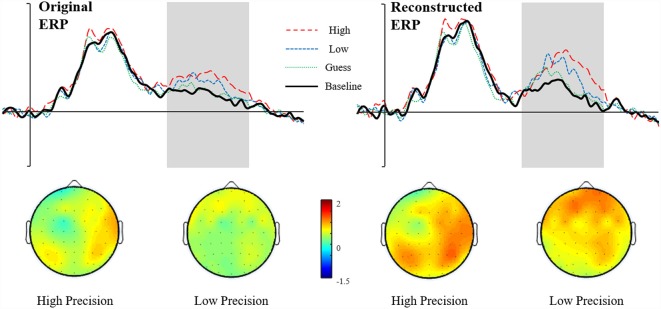
Figure 9.
Figure illustrating the effect of RIDE: on the left is the original ERP data (waveforms shown at representative electrode PR4) with the topographies for High and Low Accuracy responses directly below. On the right side is the Reconstructed ERP data (waveforms shown at electrode P5) with topographies for High and Low Accuracy shown below.

