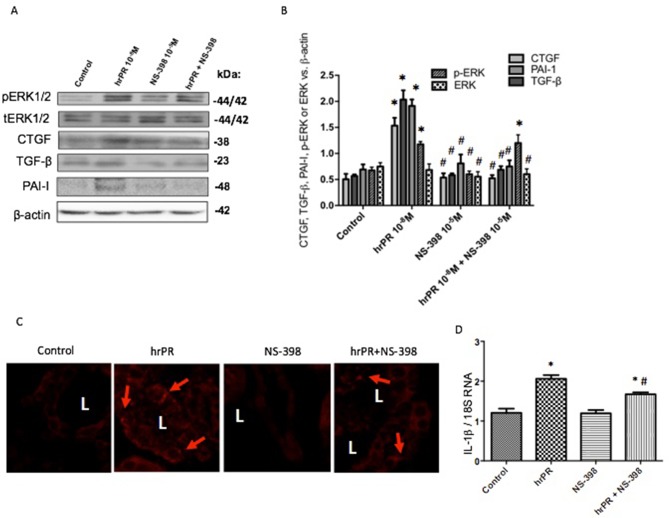
Figure 7.
Representative Western blot images (A) and quantitation (B) of phospho-ERK, total ERK, CTGF, TGF-β, and PAI-I in inner medullary tissues (n = 5). *p < 0.05 versus control, #p < 0.05 versus hrPR group. (C). Immunofluorescence of alpha smooth muscle actin (α-SMA), a fibrosis-related marker in kidney sections from control mice, saline-infused mice, and mice infused with hrPR. Staining is present in some tubular cells but not in the interstitial cells in renal slides of mice infused with hrPR. A reduced α-SMA staining was evidenced in mice infused with NS-398. (D). IL-1β mRNA relative to 18S mRNA as indicative of inflammatory damage. p < 0.05 versus control, # p < 0.05 versus hrPR group.

