FIGURE 1.
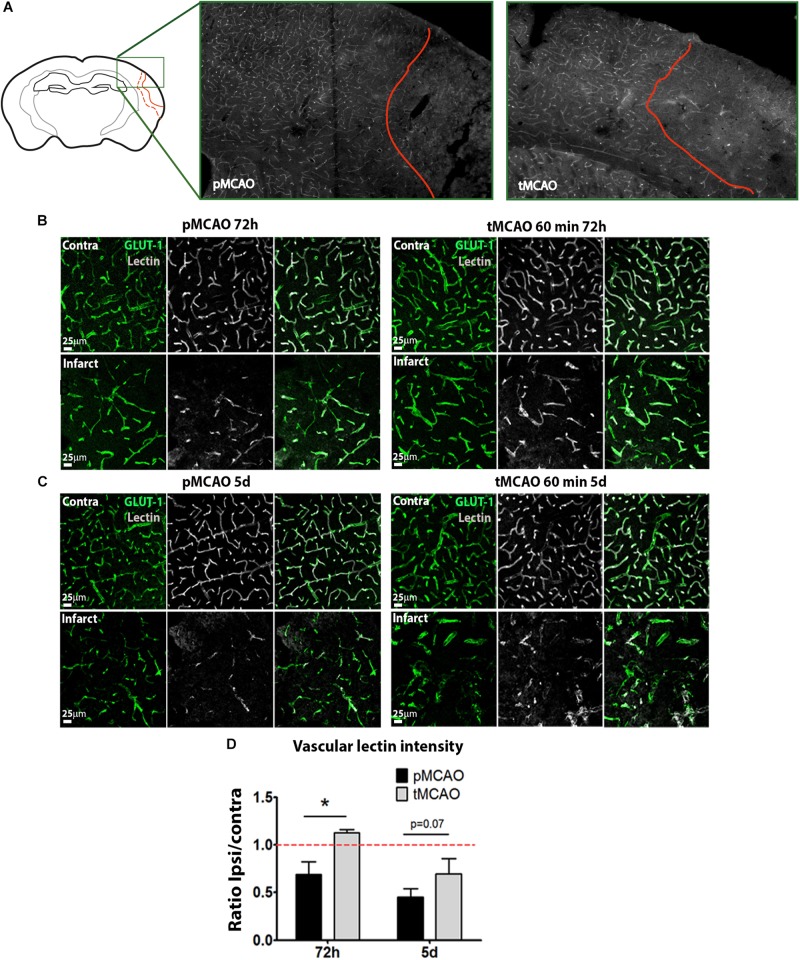
(A) Representative images of the whole area of study comprising the healthy tissue, the peri-infarct and the infarct. (B,C) Representative confocal fluorescence micrographs (20x) showing perfusion intensity in ischemic and contralateral regions at 72 h (B) and 5 days (C) after pMCAO or 60-min tMCAO. Intravascular perfusion (lectin, gray) was analyzed in Glut-1+ vessels (green). (D) Quantification of average lectin intensity in vessels expressed as ratio of ischemic/contralateral (internal control) sub-acutely (n = 6–7). * Student’s t-test p < 0.05 vs. pMCAO.

