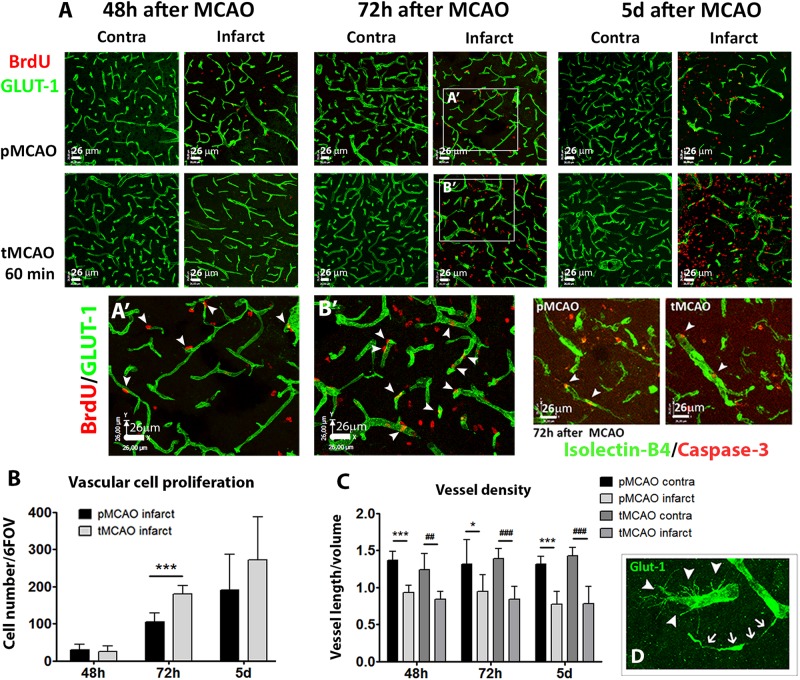
FIGURE 2.
(A) Representative confocal fluorescencemicrographs (20x) showing Glut-1+ vessels (green) and proliferating BrdU+ cells (red), or isolectin-B4+ vessels (green) and activated caspase-3+ cells (red) at several sub-acute time points after pMCAO or 60-min tMCAO. (A′,B′) show magnified fields of view of Glut-1/BrdU immunofluorescence in the infarction at 72 h after MCAO. (B) Quantification of vascular cell proliferation expressed as sum of cells in 6 fields of view in the infarction (n = 4–7). (C) Quantification of vessel density expressed as the ratio of the sum of vessel length by volume unit in six fields of view per region and animal (n = 4–7). (D) Representative magnified view showing simultaneous presence of angiogenic (arrowheads) and degenerating (arrows) Glut-1+ vessels. ∗∗∗Student’s t-test p < 0.001 vs. pMCAO (B); ∗∗∗Student’s t-test p < 0.001 vs. pMCAO contra (C); ##, ###Student’s t-test p < 0.01, p < 0.001 vs. tMCAO contra (C).

