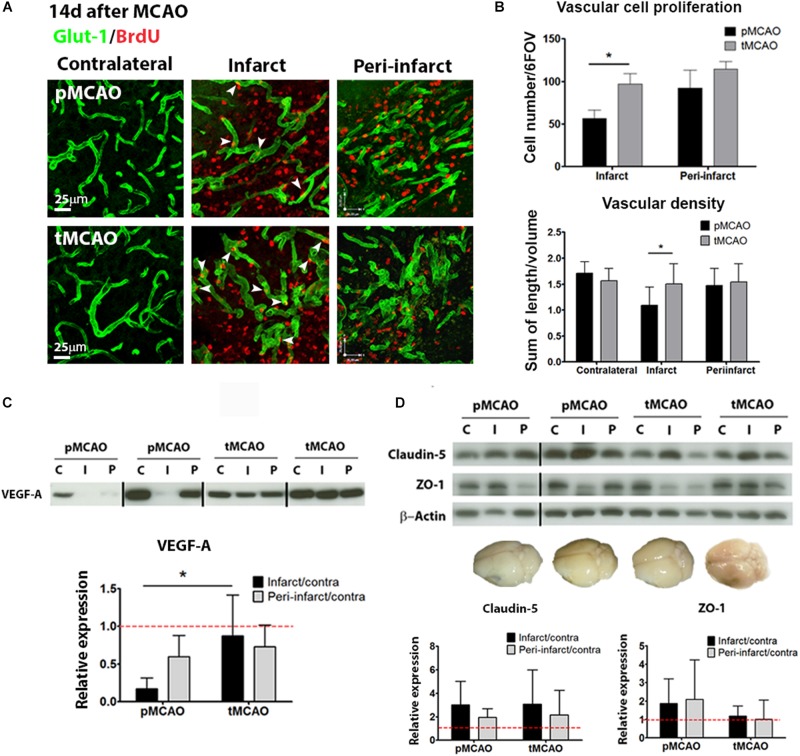
FIGURE 3.
(A) Representative confocal fluorescence micrographs (40x) showing Glut-1+ vessels (green) and proliferating BrdU+ cells (red) at post-stroke day 14. (B) Quantification of vascular cell proliferation (n = 6–8) and vascular density (n = 7–9) at post-stroke day 14. (C) Cropped blots from a representative VEGF-A western blot and quantification in contralateral (C), infarcted (I) and peri-lesional (P) tissue at post-stroke day 14. Complete gels are shown in Supplementary Figure 3 (n = 5–6). (D) Cropped blots from representative ZO-1 (n = 5–6) and claudin-5 (n = 4–6) western blots and quantifications, and brain photographs showing absence of in vivo BBB permeability at post-stroke day 14. Complete gels are shown in Supplementary Figure 3. * Student’s t-test p < 0.05 vs. pMCAO.

