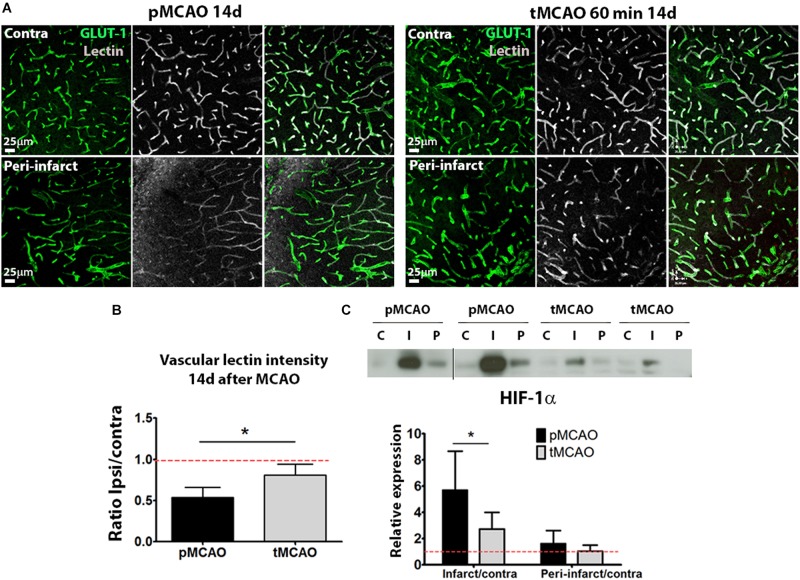
FIGURE 4.
(A) Representative confocal fluorescence micrographs (20x) showing perfusion intensity in ischemic and contralateral regions at post-stroke day 14. (B) Quantification of average lectin intensity in vessels expressed as ratio of ischemic/contralateral (internal control) sub-acutely. (C) Cropped blots from a representative HIF-1α western blot and quantification at post-stroke day 14, expressed as ratio ischemic/contralateral. Complete gels are shown in Supplementary Figure 3 (n = 5–6). *Student’s t-test p < 0.05 vs. pMCAO.

