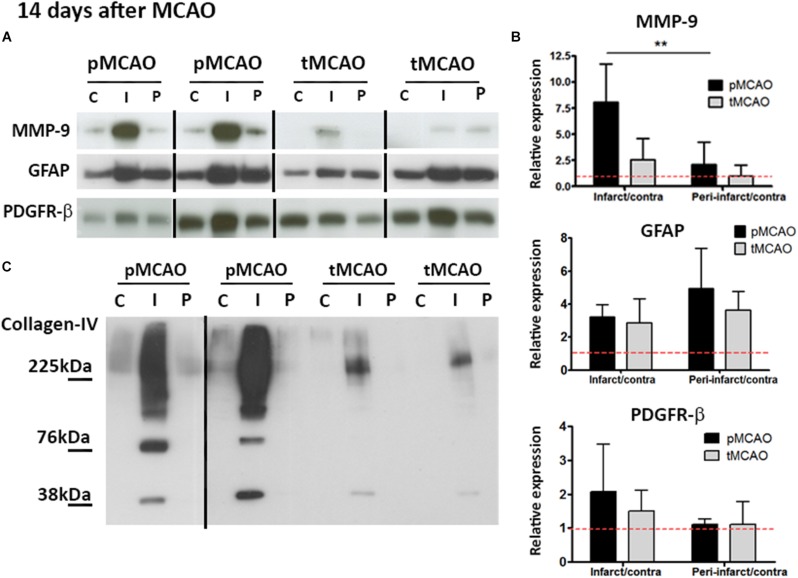
FIGURE 5.
(A,B) Cropped blots from representative MMP-9 (n = 5–6), GFAP (n = 4–5), and PDGFR-β (n = 5–6) western blots (A) and quantifications (B) in contralateral (C), infarcted (I) and peri-lesional (P) regions at post-stroke day 14. ∗∗Student’s t-test p < 0.01 vs. infarct/contra. Complete gels are shown in Supplementary Figure 3. (C) Representative collagen-IV cropped western blots showing expression of non-degraded protein (225 kDa) and degradation fragments (76 and 38 kDa) at post-stroke day 14. Complete gels are shown in Supplementary Figure 3.

