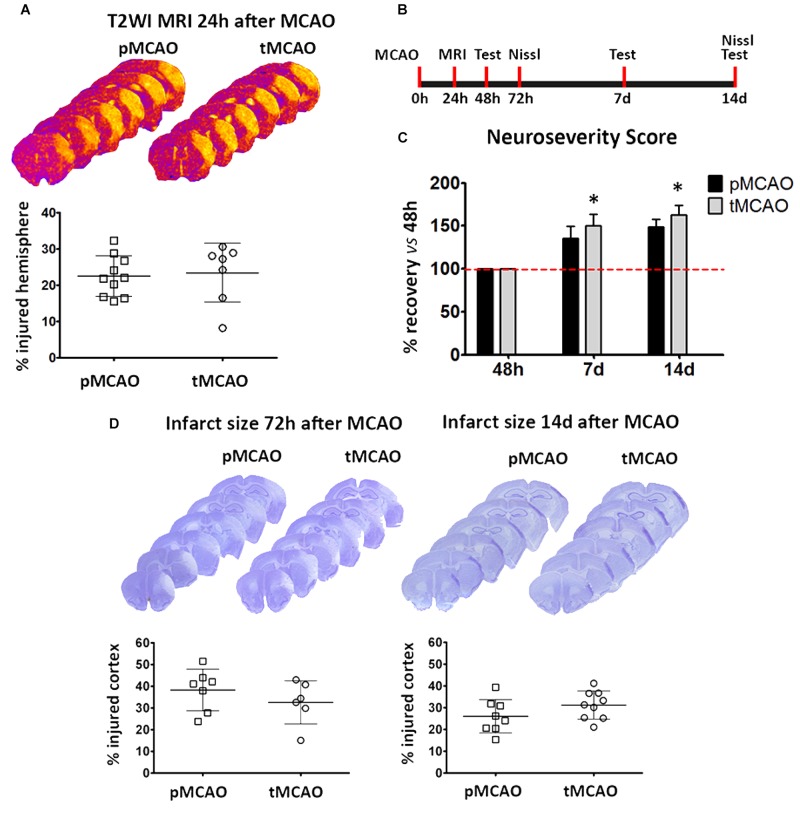
FIGURE 6.
(A) Representative series of T2WI-MRI planes and volumetric quantification showing infarct volumes at 24 h after pMCAO or tMCAO. (B) Schematic representation of the experimental design for the measurement of infarct volume and functional deficits after MCAO. (C) Data from functional assessment performed at 48 h (basal), 7 and 14 days after pMCAO or tMCAO (n = 7). (D) Representative series of Nissl-stained brain sections and corresponding graphs showing the extent of ischemic injury at 72 h and 14 days after permanent (pMCAO) or transient (60 min) middle cerebral artery occlusion (tMCAO). *Two-way ANOVA p < 0.05 vs. pMCAO.

