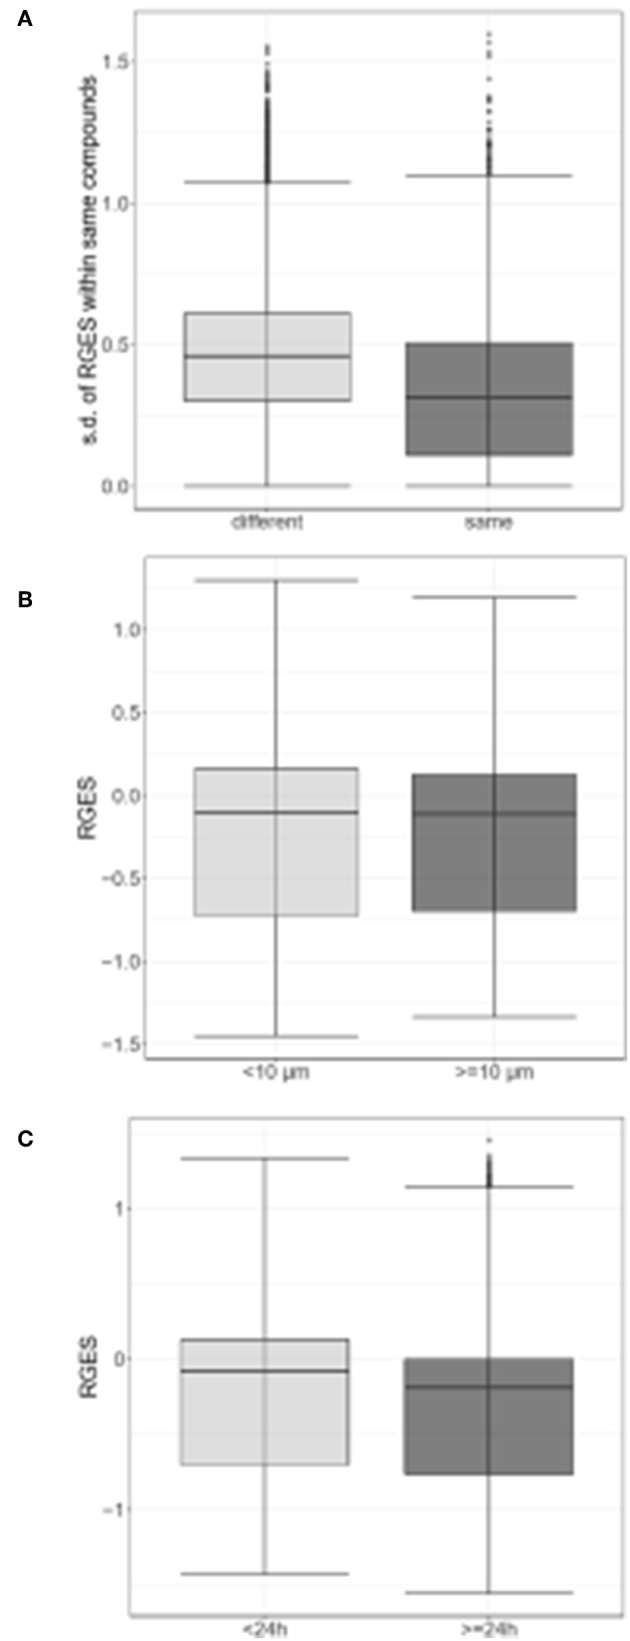
Figure 2.

Differences in reverse gene expression scores (RGES) under the various biological conditions. (A) Standard deviation (s.d.) of reverse gene expression scores (RGES) of individual compounds across different cell lines (gray) vs. across replicates within the same cell line (black gray). (B) RGES distribution between drug concentrations<10 μM (gray) and ≥10 μM (black gray). (C) RGES distribution between treatment durations<24 h (gray) and ≥24 h (black gray). Treatment duration and compound concentration were categorized based on compound data in LINCS. P-value was calculated using a Wilcoxon signed-rank test.
