
Figure 4.
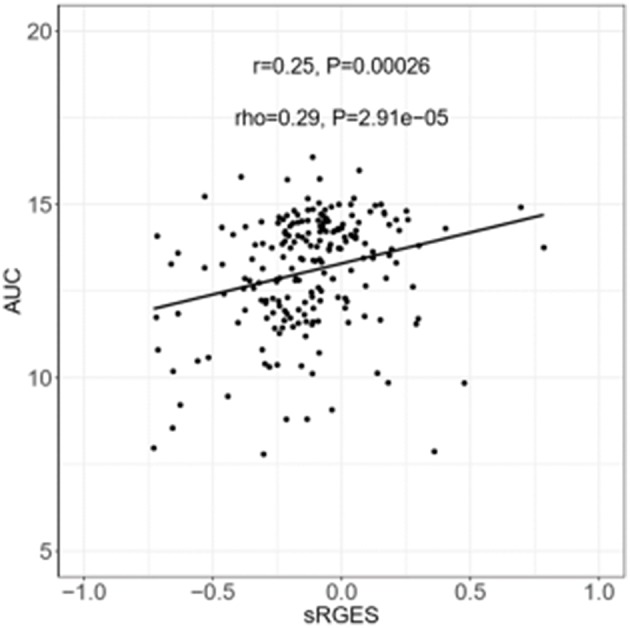
Correlation between AUC and sRGES of compounds. AUC data were retrieved from CTRP. Sensitivity levels were measured in the form of cellular ATP levels as a surrogate for cell number and growth using CellTiter-Glo assays. A compound-performance score was computed at each concentration of compound. Median values were used to summarize AUC across all prostate cancer cell lines examined. A Spearman's correlation test was used to analyze the correlation between sRGES and AUC. AUC, areas under the concentration-response curve. CTRP, the cancer therapeutic response portal.