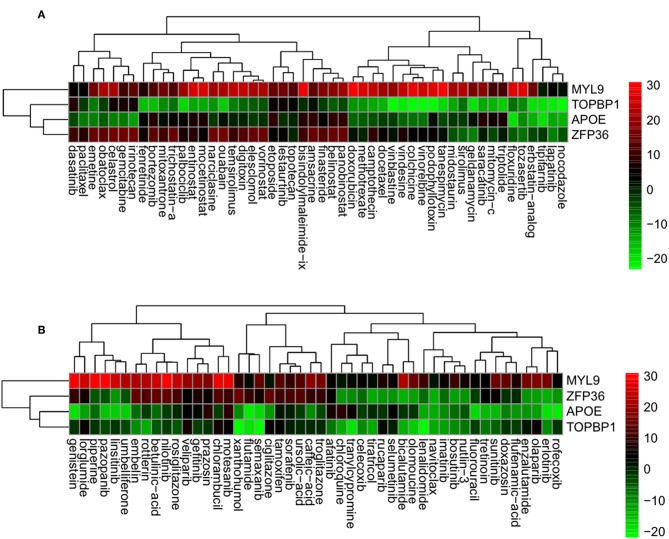
Figure 5.
Genes having reversed expression in response to treatment with active (A) and inactive (B) compounds. Low rank and high rank suggests that the gene expression is down- and upregulated, respectively, by the corresponding compound. The heatmap indicates the relative position of a gene in ranked drug expression data. Position are normalized and compound columns are ordered according to IC50. Red and green colors indicate up- and down-regulation, respectively, after compound treatment.

