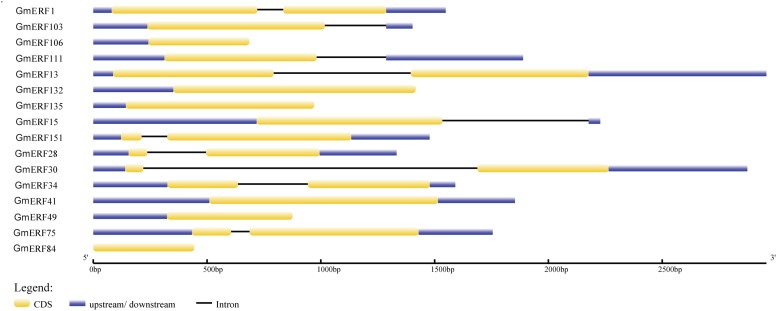
FIGURE 1.
Intron-exon structure of candidate soybean ERF genes. Genome data for candidate ERF genes was obtained from JGI Glyma1.0 annotation. Intron-exon structure was produced using the GSDS online tool by submitting CDSs and genomic sequences of candidate genes. Yellow boxes represent exons, blue boxes represent introns, and black lines represent untranslated regions (UTRs).

