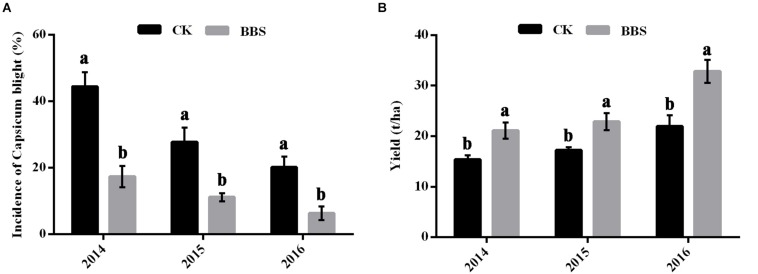
FIGURE 1.
Effects of different fertilization management programs on disease (A) and yield (B) of sweet pepper in 2014–2016. Data are expressed as the mean ± SD (n = 3). Significant differences between different treatments are indicated as different letters on top of the data bars. The statistical analysis was determined by a Tukey’s Studentized Range (HSD) test: α = 0.05, n = 3.

