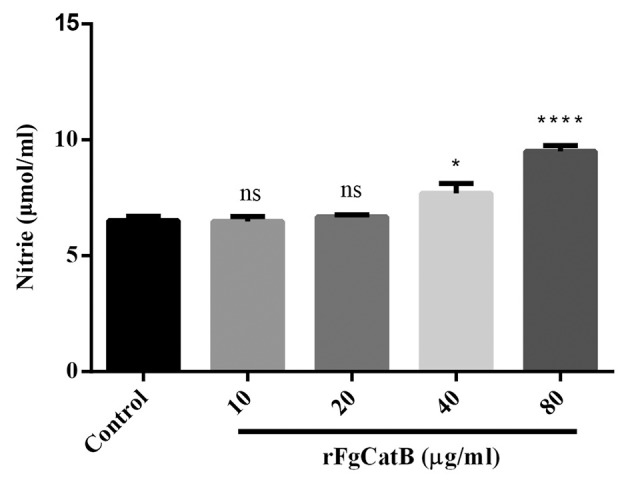
Figure 6.

Effects of rFgCatB protein on the production of NO. PBMCs were treated with PBS or with serial concentrations of rFgCatB protein and maintained at 37°C for 24 h. NO concentration was measured by Griess assay. Graphs represent means ± standard deviations of data from three independent biological replicates (10 μg/ml: ANOVA, F(4, 10) = 27.91, P = 0.9998; 20 μg/ml: ANOVA, F(4, 10) = 27.91, P = 0.9702; 40 μg/ml: ANOVA, F(4, 10) = 27.91, P = 0.0220; 80 μg/ml: ANOVA, F(4, 10) = 27.91, P < 0.0001). Asterisks indicate significant differences between rFgCatB-treated and PBS-treated control cells (*p < 0.05; ****P < 0.0001; ns, non-significant compared with control).
