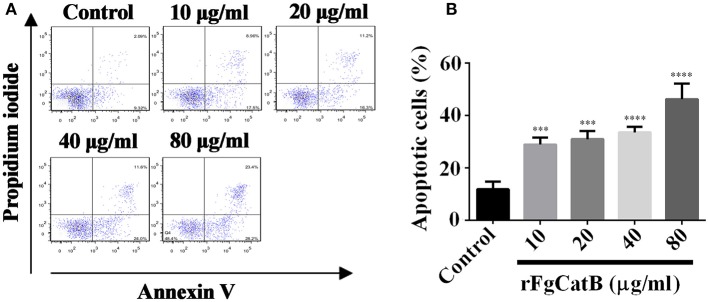
Figure 7.
rFgCatB protein induced apoptosis in goat PBMCs. Annexin V/PI staining was used to quantify apoptotic cells by flow cytometry. (A) The FACS plot showing apoptosis of PBMCs in response to exposure to rFgCatB protein. (B) Apoptotic cells (Annexin V+/PI-) were plotted and compared with the percentage of cell population. Graphs represent means ± standard deviations of data from three independent biological replicates (10 μg/ml: ANOVA, F(4, 10) = 34.92, P = 0.0006; 20 μg/ml: ANOVA, F(4, 10) = 34.92, P = 0.0003; 40 μg/ml: ANOVA, F(4, 10) = 34.92, P < 0.0001; 80 μg/ml: ANOVA, F(4, 10) = 34.92, P < 0.0001). The asterisks indicate significant differences between rFgCatB-treated and PBS-treated control goat PBMCs (***P < 0.001; ****P < 0.0001 compared with control).

