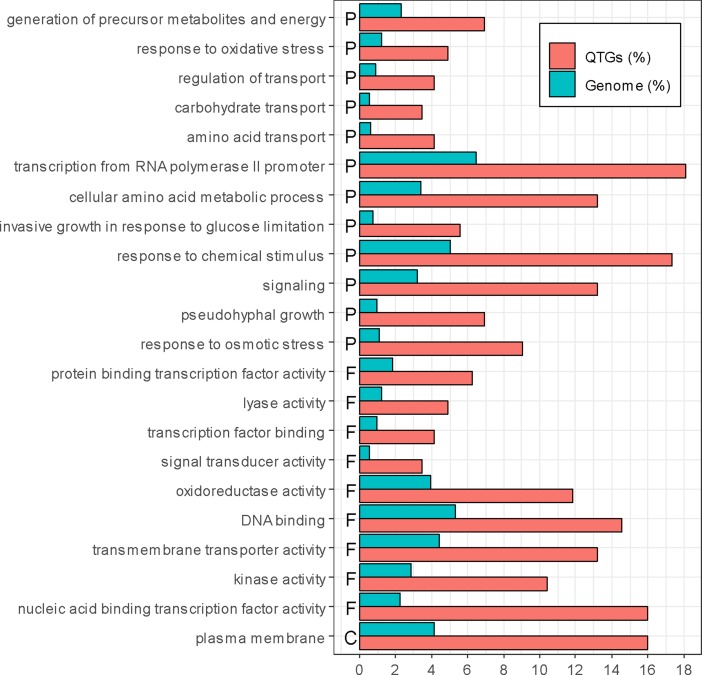
Figure 3.
Enrichment of QTGs. Only significantly over-represented or under-represented categories are represented (chi-squared test, p-value < 0.05, with Bonferroni adjustment for multiple tests). The percentage of genes in the genome and in the QTGs is indicated in blue and red, respectively. F, P, and C represent molecular function, biological process, and cellular component, respectively.

