
Figure 1.
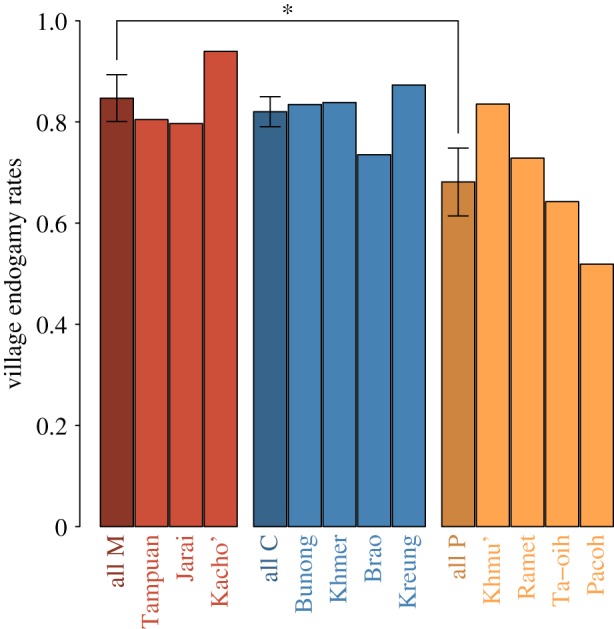
Mean village endogamy rate for each population. The first dark bar in each group represents the mean village endogamy rate in this group (with standard error). Asterisk indicates statistical significance (p-value < 0.05) assessed by generalized linear mixed model. (Online version in colour.)